University Campus is an application of artificial intelligence and Big Data in hospitality that enables optimizing operations, reducing costs, and making data-driven decisions across multi-location chains. Tuesday, 13:10. On a campus with 9,000 enrolled students, the law school cafeteria has a 25-minute queue. 300 meters away, the main dining hall has prepared 1,200 set menu servings and has only served 780. In the food court of the new building, the poke stand has run out of rice and the wrap stand has product for two more hours. The vending machines in the north wing ran out of sandwiches at 12:30. Four service points. Four different problems. One campus, one lunch hour.
Each service point is a different business within the same campus
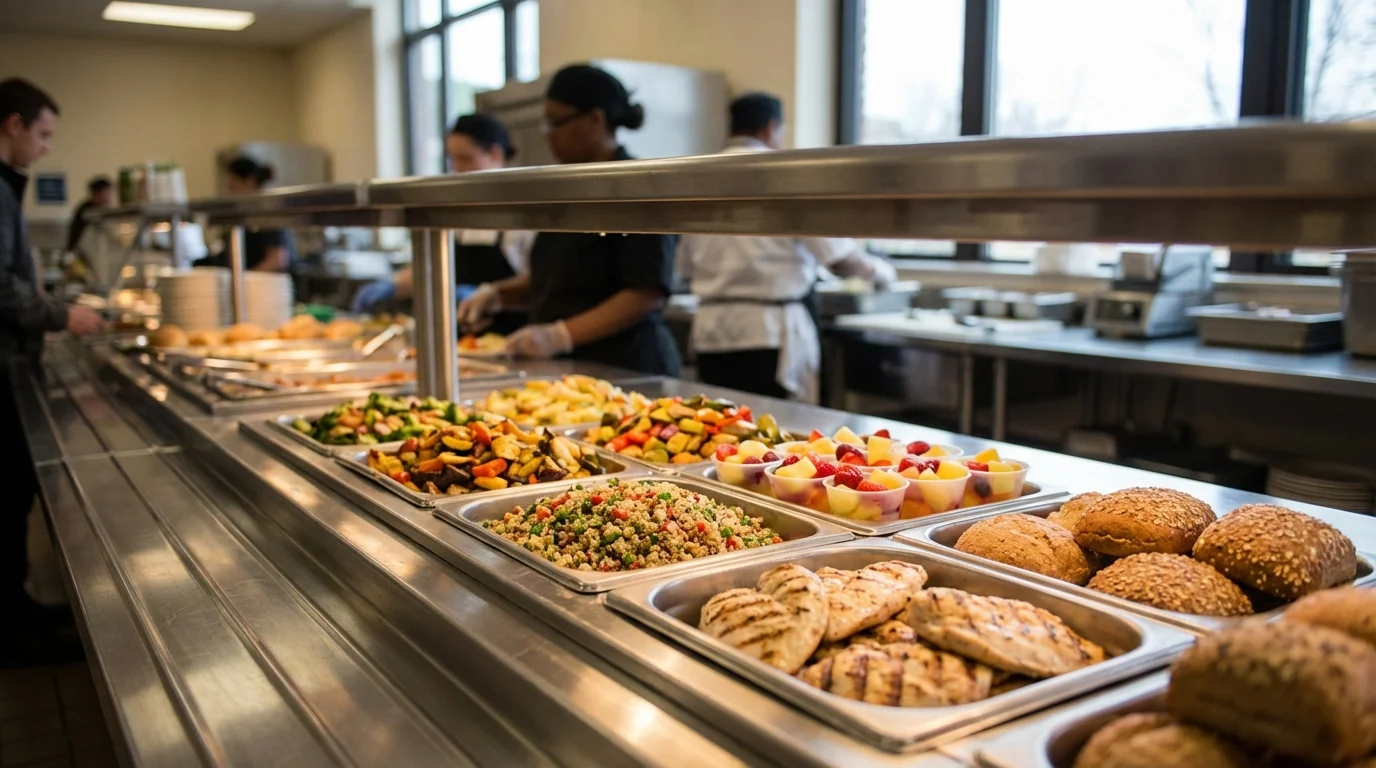
What makes the university environment unique compared to other food service segments is the coexistence of radically different formats under a single operator. A typical campus can have a dining hall with a set menu at a fixed price, faculty cafeterias with an a la carte offering, food courts with multiple themed stands, grab-and-go areas, and vending machines distributed across the campus.
Each format has its own demand profile. The set menu dining hall has concentrated peaks between 13:00 and 14:30. The faculty cafeteria receives waves linked to class changes. The food court has more dispersed demand dependent on the daily offering. And vending covers impulse demand between hours.
Academic seasonality: exams, holidays, and the Friday effect
University demand does not follow the patterns of a restaurant or a school cafeteria. It has its own logic dictated by the academic calendar, and that logic changes radically between periods.
Set menu vs à la carte: two forecasting worlds coexisting
An operator managing a campus has to master two completely different forecasting logics at the same time. The dining hall with a set menu works like any other institutional catering service: a 4–5 week cycle menu, diners eat what is available, and forecasting is based on the dish of the day and expected absenteeism.
The food court and cafeterias operate like commercial foodservice: à la carte offering, diners decide on the spot, and forecasting is needed at the individual item level. How many ham sandwiches, how many Caesar salads, how many lattes. Forecasting granularity has to go down to the SKU.
Data measured across active Controliza clients.
On top of that, the offering at one outlet directly affects demand at the others. If the food court introduces a new Asian food station, the main dining hall loses 10–15% of diners during the first few weeks. If the dining hall launches a special seasonal menu, the food court feels the drop. Forecasting each outlet as if it were independent is a systematic mistake. The campus is a system of communicating vessels where demand flows from one outlet to another depending on the day, the offer, and the point in the academic calendar.
How does AI solves multi-site forecasting?
Controliza tackles the complexity of a university campus with an approach no spreadsheet can replicate: independent forecasting for each service point, connected at campus level to capture cannibalization and real-time demand redistribution dynamics.
One model per outlet, connected to the ecosystem
Controliza’s Forecasting module generates an independent forecast for each service point. Each outlet has its own model, trained on its historical sales data, offer format, and demand profile. But the models don’t operate in silos: they are interconnected. When the AI detects that one outlet is set to grow, it identifies where that additional demand is coming from and adjusts the others downward proportionally.
The academic calendar as a key variable
Controliza incorporates the full academic calendar: teaching periods, midterms, finals, long weekends, holidays, open days, and graduations. The system learns that exam week in June reduces dining hall demand by 45% while increasing demand at the library café by 35%. These patterns are automatically applied to the forecast for each period.
Campus-wide consolidated purchasing
Once each outlet has its granular forecast, Controliza consolidates purchasing needs across the entire campus. If the dining hall needs 60 kg of chicken and the food court needs 25 kg, the supplier order is placed as a single consolidated purchase. This lets you buy exactly what you need, negotiate better on volume, and simplify receiving logistics through a single delivery point.
From recipe costing to delivery notes: when forecasting becomes real operations
On a university campus, getting attendance right isn’t enough. The real problem starts when that forecast doesn’t translate into purchasing, production, and replenishment across service points. If the dining hall adjusts portions but the café doesn’t update its orders, you still end up with waste on one side and stockouts on the other. And when cyclical menus, grab-and-go, vending, and à la carte options all coexist, any mismatch directly impacts food cost, service times, and the student experience.
The real challenge is connecting planning with execution. Every change in demand should automatically adjust recipe costing, purchasing needs, and delivery note receiving, without losing traceability or HACCP control. That’s where many operators are still relying on disconnected spreadsheets, manual forecasts, and reactive decisions. The result is familiar: overproduction of low-demand dishes, more expensive last-minute purchases, and little visibility into which format is eroding margin.
With Forecasting, Controliza doesn’t just tell you how many portions you can serve. It combines historical data, the academic calendar, service-point behavior, and menu cycles to anticipate demand in a way that’s actually useful. That forecast connects with purchasing, production, and receiving so you can adjust orders, validate delivery notes, strengthen traceability, and reduce waste without compromising availability. This is how you turn a fragmented operation into a single campus-wide logic: less waste, better service, and faster decisions.
One demand signal for purchasing, production, and traceability
The real problem on a university campus is not only forecasting demand at each service point. It is turning that forecast into coordinated action before the lunch rush starts. If the dining hall, cafeteria, food court, and vending are planned separately, the result is familiar: duplicated purchasing, stock imbalances, avoidable waste, and poor traceability between central production and final sale. A forecast that stays in a dashboard does not reduce food cost.
With Forecasting connected to purchasing, inventory, and kitchen operations, Controliza converts demand signals into operational decisions. You can adjust production by outlet, rebalance transfers between service points, and align delivery notes with real expected consumption. That means fewer stockouts in high-traffic areas, less overproduction in low-demand formats, and tighter control of recipe costing across mixed set menu and à la carte environments.
The impact is measurable: lower waste, more accurate purchasing, and stronger traceability from supplier intake to service point. For multi-location HORECA operators, that shared data model typically reduces food cost by 3–5% and cuts waste by more than 20%, while giving teams a single operational view of the entire campus.
How does AI solves multi-point forecasting?
Controliza addresses university campus complexity with an approach no spreadsheet can replicate: independent forecasting per service point, but connected at campus level to capture cannibalization and redistribution dynamics in real time.
One model per point, connected to the ecosystem
Controliza's Forecast module generates an independent prediction for each service point, but the models are interconnected. When the AI detects one point will rise, it identifies where that additional demand comes from and adjusts the others proportionally.
Academic calendar as a key variable
Controliza incorporates the complete academic calendar: lecture periods, midterms, finals, holidays, open days, graduations. The system learns that June exam week reduces dining hall demand by 45% but increases the library cafeteria by 35%.
Consolidated campus-level purchasing
Once each point has its granular forecast, Controliza consolidates purchasing needs across the entire campus. This enables buying exactly what is needed, negotiating by volume, and simplifying reception logistics to a single point.
Data measured in active Controliza clients.
Do you manage multiple service points on university campuses?
Discover how Controliza forecasts demand by service point and consolidates purchasing across the entire campus. Request a personalized demo and see how to reduce waste without leaving any point understocked.
If you want to go deeper, we recommend reading Theoretical vs. Actual Consumption: The KPI That Separates Profitable Chains From the Rest.
