In most hospitality groups, food waste is "known" but not controlled: what gets thrown away at closing is written down, and everything else is ignored. The gap between what you buy and what you actually sell can eat several points of food cost without anyone seeing it, because it is spread across dozens of small daily losses that no monthly close ever explains. This guide covers what food waste control is, how to calculate shrinkage with a simple formula and a worked example in euros, what percentage is reasonable, and which levers actually reduce it.
What is food waste control?
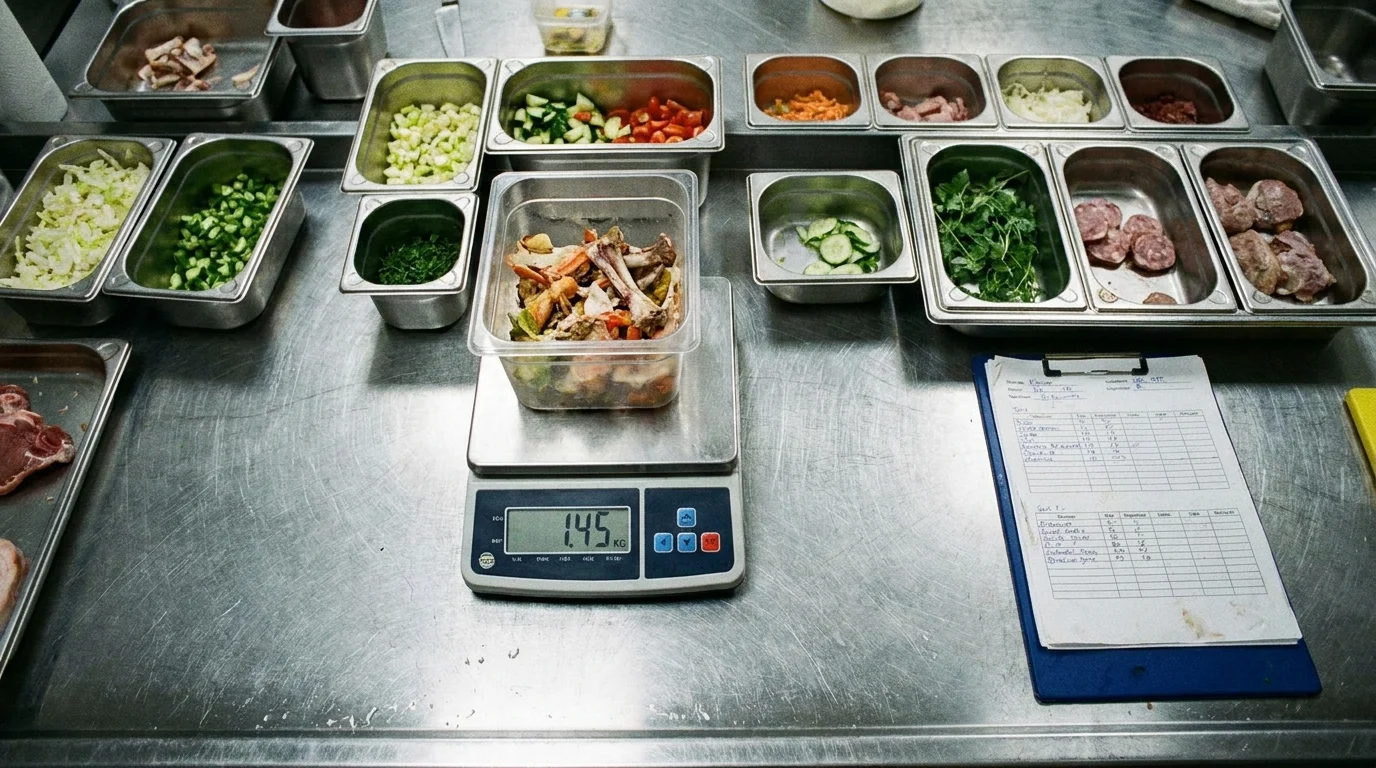
Food waste control is the process of measuring, recording and reducing the difference between the product you buy and the product you actually sell or serve. It is not just writing down what gets thrown away: it means comparing theoretical consumption — what your recipe costings say you should have used given your sales — against actual consumption — what really left your inventory — and acting on the difference.
That definition has an immediate practical consequence: without reliable inventories and up-to-date recipe costings, there is no real waste control, only estimates. And in a multi-site group the problem multiplies: every location loses product differently, each one records it (or not) its own way, and head office cannot compare. The group's aggregate waste shows up diluted in the food cost at the monthly close, when there is no decision left to make.
Types of waste: operational, known and unknown
Not all waste is the same, and confusing the types is the first reason it goes uncontrolled. In hospitality, three kinds coexist:
Operational (process) waste. The loss inherent to handling product: trimming, cutting, deboning, cooking. A whole salmon does not yield 100% of its weight in portions. This waste is normal and predictable — which is exactly why it should already be built into the yield of every recipe costing. If your recipe card does not include it, your theoretical consumption is wrong from the start.
Known waste. What gets recorded: expired product, breakage, production errors, buffet items pulled at closing. It is the visible tip of the iceberg — the part that shows up in the waste log when the discipline to record it exists.
Unknown waste. The inventory difference nobody explains: over-portioning in the kitchen, receiving errors accepted without checking, unrecorded consumption, comps that were never written down. It appears in no log, and in practice it is usually larger than the known waste. It is exactly the pain that comes up most often in multi-site operations: nobody measures where product is being lost, so the loss has no owner and no cause — and what has no cause cannot be fixed.
How do you calculate food waste? Formula and example
The calculation rests on three numbers any operation can produce: opening stock, purchases for the period, and closing stock. With those:
Waste = actual consumption − theoretical consumption (sales × recipe costing)
Waste % = waste € ÷ actual consumption € × 100
An example with round numbers. A location buys €20,000 of product per month. It started the month with €6,000 of stock and finished with €5,500. Its actual consumption is 6,000 + 20,000 − 5,500 = €20,500. Based on its sales and recipe costings, theoretical consumption for the month was €18,900. The difference — €1,600 a month, 7.8% of consumption — is waste: product that left the storeroom and never became a sale. Over a year, around €19,200 in a single location. In a group, multiply it by the number of sites.
Two conditions keep this calculation honest. First: the counts have to be reliable — if your inventory lies, the calculated waste is fiction. Second: recipe costings have to be alive — a three-month-old costing with old prices and recipes shifts the "waste" to where it is not. The math is simple; the data discipline underneath it is where most operations fail.
What percentage of food waste is acceptable?
It depends on the type of operation, and any single figure would be misleading. The ranges we see in practice across multi-site groups:
Operational ranges observed across multi-site groups; perishable discard measured in active Controliza customers.
But the useful criterion is not the absolute figure: it is traceability. The acceptable percentage is the one you can explain. A 6% waste rate with assigned causes (how much is operational, how much expiry, how much inventory difference) is an operation under control with room to improve. An "official" 3% that only captures what someone remembered to write down is lack of control with good optics. The red flag is not high waste: it is waste without a cause.
How to reduce food waste: 5 levers
1. Reliable inventory: without real stock there is no control
The whole calculation above rests on opening and closing stock. If counts are irregular, every site counts its own way, or differences get written off without investigation, the calculated waste means nothing. An inventory with guided counts and real-time stock is the foundation: it turns an inventory difference into a data point with a date, a site and a product family — the starting point for assigning causes.
2. Living recipe costings: theoretical consumption has to be true
Theoretical consumption comes from multiplying sales by recipe costings. If the kitchen's real recipe no longer matches the card, or yields do not reflect real prep waste, the theoretical vs actual comparison points at the wrong culprits. Keeping costings connected to production means the gap that remains is real waste, not card error.
3. Produce to demand, not to fear
A huge share of waste is born before the product ever reaches the kitchen: buying and producing "just in case". Every manager's safety buffer is scheduled waste. Adjusting production to a demand forecast by item, day and location attacks waste at the source: groups that move from producing on experience to producing on forecasts cut overproduction waste — in daily perishables, by as much as 30-40%.
4. Validate receiving: the waste that walks in the door
Part of the "waste" was never yours: product that did not arrive, arrived short, or arrived at a price different from the agreed one — and was accepted without checking. Those delivery note deviations — typically 1-3% of purchased volume, in small repeated differences nobody sees individually — later surface as inventory differences. Reconciling order, delivery note and invoice at receiving closes that door.
5. Compare across sites: the best location sets the standard
In a group, the cheapest lever is comparability. If the same business concept wastes 3% in one location and 9% in another, the difference is not bad luck: it is process. Measuring waste the same way in every site and comparing it weekly turns the best location into the group's replicable standard — and makes visible in days what the monthly close was hiding.
Do you know how much each of your locations loses to waste — and why?
Controliza connects inventory, recipe costings, receiving and forecasting so that every site's waste has a figure and a cause. Request a personalized demo and work out how much margin you can recover.
The multi-site challenge: where waste control lives (and what your ERP's role is)
Food waste control does not live in the ERP, and that is not a flaw of the ERP: it is simply not its job. Your ERP consolidates and does the accounting — it will tell you what consumed product cost, but not where it was lost, at which site, in which family or for what cause. That measurement belongs to the operational layer: the one that sees the order, the receiving, the count, the recipe costing and the sale, site by site, and can cross-check them daily.
That is why waste control in a group is not solved by adding one more module to the ERP or with spreadsheets per location: it is solved with an operational layer that measures the same way in every site and feeds the ERP already-validated data — without replacing your ERP. Waste stops being an opaque line inside food cost and becomes an operational metric with an owner, a cause and a trend. And what has an owner and a cause gets reduced.
Frequently asked questions about food waste control
Are shrinkage and food waste the same thing?
Not exactly. Food waste is the food that ends up in the bin; shrinkage is any difference between actual and theoretical consumption, whether or not food was thrown away: inventory differences, over-portioning and receiving deviations are shrinkage too. All food waste is shrinkage; not all shrinkage is food waste.
How often should waste be calculated?
The full calculation (with inventory) at the pace of your counts — weekly or biweekly for critical families, monthly at minimum. Known waste (expiry, discarded production) is recorded daily: leave it for the close and you lose the cause.
What is unknown waste and why does it matter so much?
It is the inventory difference with no recorded cause: over-portioning, receiving errors, unrecorded consumption. It matters because it is usually bigger than known waste and because, having no cause, nobody fixes it — it gets absorbed as "the way operations are" and paid for every month.
What do I need to start controlling waste?
Three things, in this order: reliable inventory counts done the same way across sites, up-to-date recipe costings that make theoretical consumption credible, and a daily log of known waste with causes. With that you can already run the formula in this guide; forecasting and receiving validation come next to reduce it.

